At its core, Growmentum empowers you to understand the duration of every task, monitor its progress, and identify who is responsible. This intricate coordination requires substantial data and organization, providing numerous opportunities for analysis, continuous improvement, and transparency.
To quench this never-ending thirst for the next sweet drink of data, we have crafted a comprehensive dashboard. While standard charts are available, many are customized to client specifications, addressing specific questions or data points you wish to monitor. Our goal is to offer you and your team a robust platform for planning, tracking, and reflecting on greenhouse tasks.
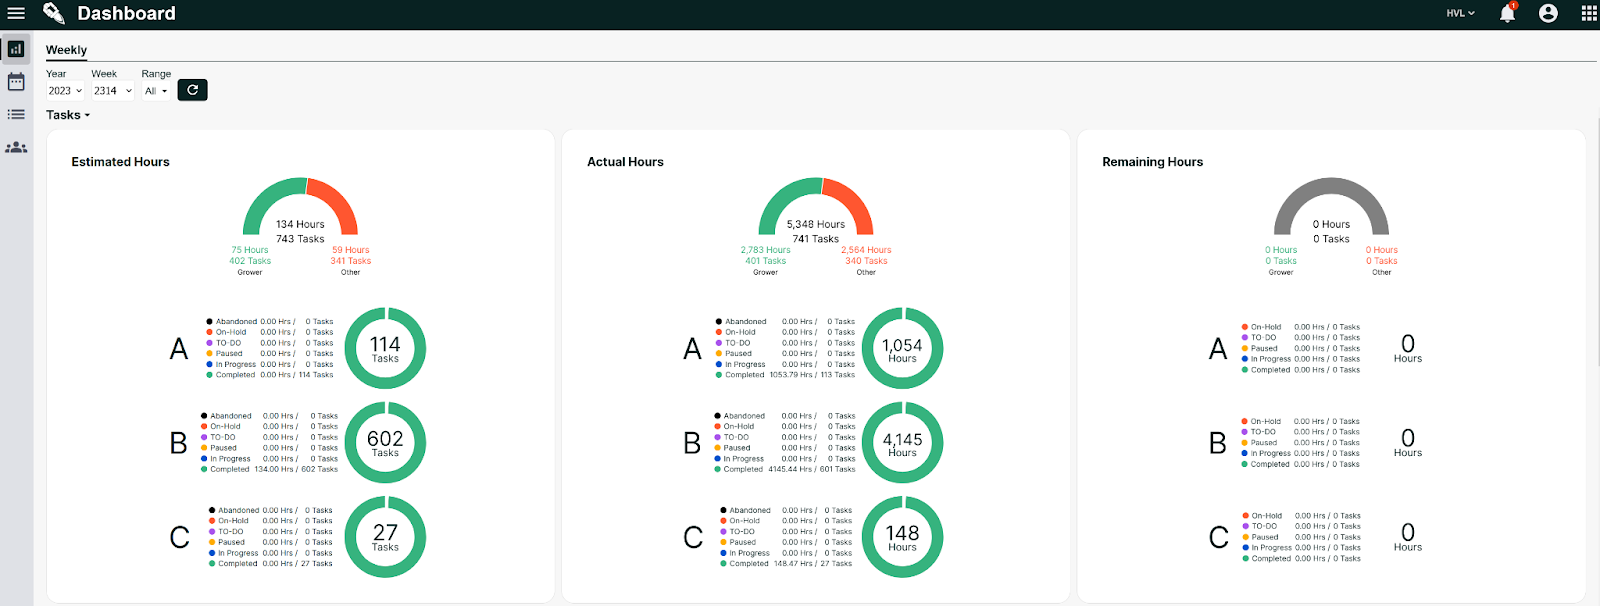
Estimated, Remaining, and Actual Time by Priority
In the example below, we present a chart displaying the estimated, remaining, and actual time spent on each task, categorized by priority. This visualization allows your leadership team to assess which tasks were prioritized and how they were ranked upon creation.
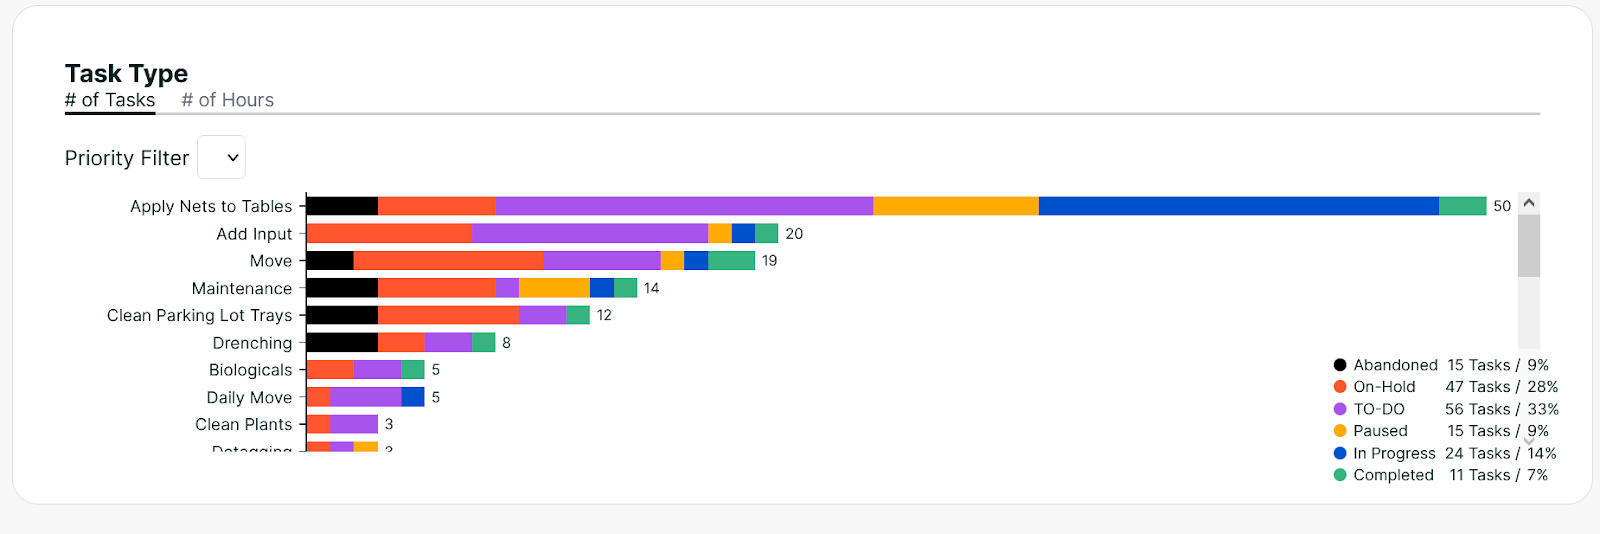
Tasks by Type
Another chart illustrates the number of tasks broken down by type. This overview provides insights into the variety of tasks your team is engaged in, facilitating better resource allocation and task management.
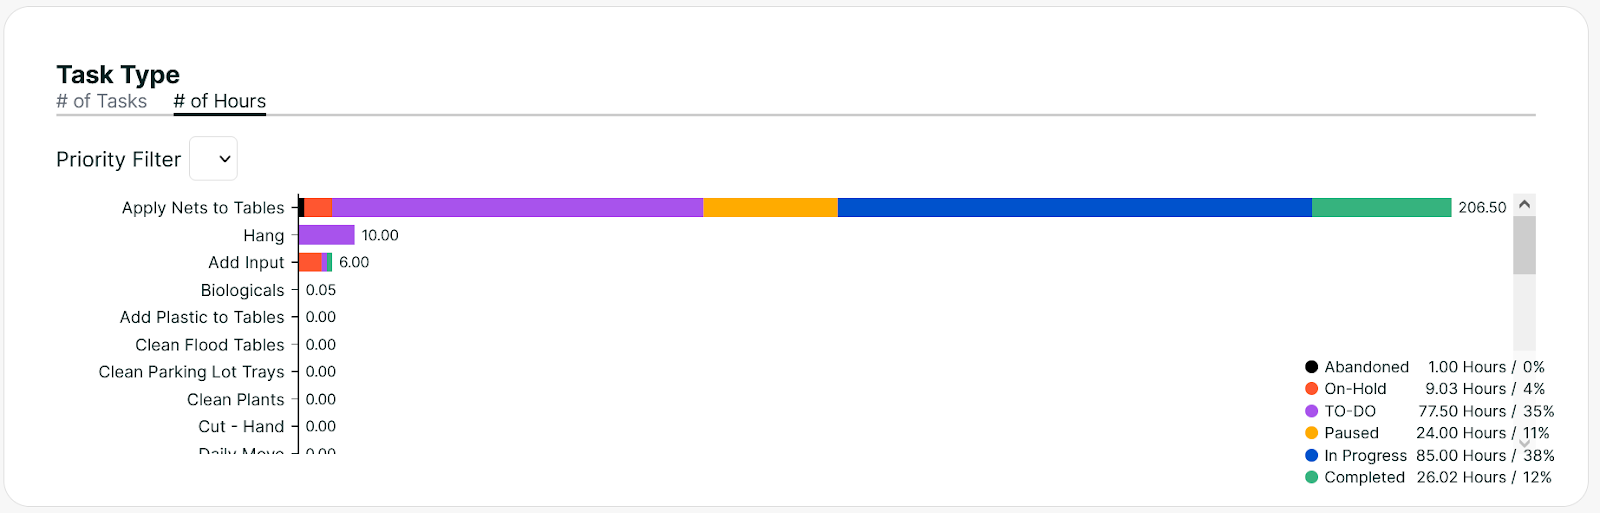
Hours Spent per Task Type
A similar chart, but instead of showing the number of tasks, it highlights the hours spent on each task type. This helps in understanding time allocation and efficiency across different task categories.
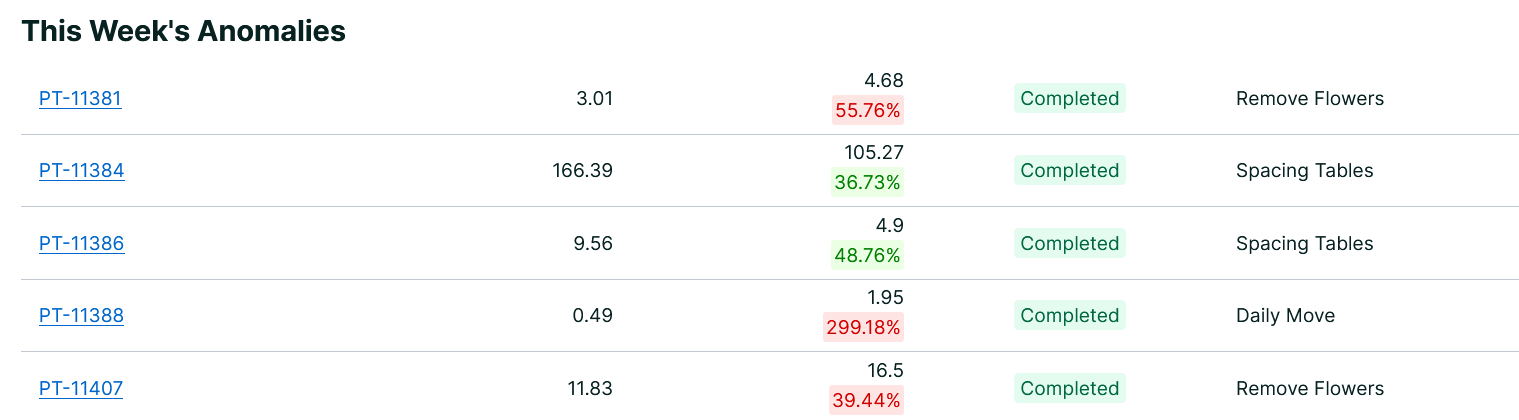
Tracking Anomalies
While the ideal scenario is for every task to adhere to its estimated timeframe, reality often diverges. This is why we track anomalies. The chart below indicates instances where tasks took significantly less or more time than expected. Analyzing these anomalies offers valuable insights into why certain tasks deviated from their estimates, enabling process improvements.
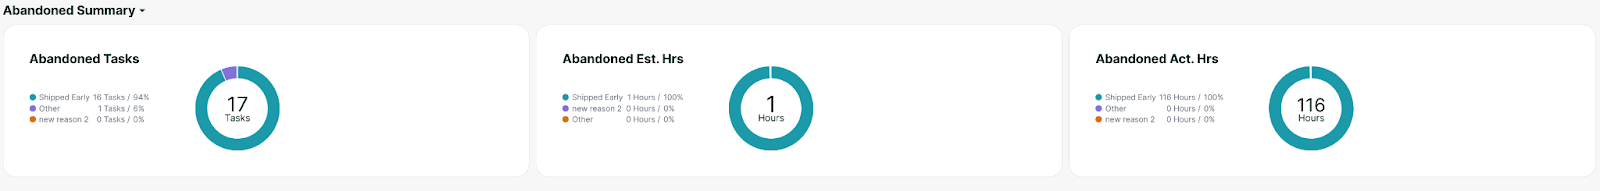
Abandoned Tasks
In the following chart, we display the hours and counts for abandoned tasks. This works to help growers understand the reasons behind task abandonment, whether due to changing priorities, early completion, or other factors. The data surrounding abandoned tasks is fully customizable, allowing you to tailor it to your specific needs.
Closing Thoughts
Our dashboard collection is continuously evolving, driven by feedback from growers like you. We are committed to transforming information into actionable data, helping you and your team make informed decisions, and ultimately cultivating the best plants.
Ready to learn more?
If you’re interested in discovering more about our dashboard and other features of the Growmentum platform, reach out to us today. Our team is eager to assist you in optimizing your greenhouse management and driving your business forward.